“The effectiveness of data visualization can be gauged by its simplicity, relevancy, and its ability to hold the user’s hand during their data discovery journey.”
BACKGROUND:
One of India’s top automobile firms approached Amlgo Labs for helping them in analysing their different datasets which they had gathered in past few years. The data was scattered across different Sources and formats like structured data sets in (RDBMS tables) & unstructured in excel files, folders, pdf files etc. Once consolidated the records were in millions and Attributes in double digits.
CHALLENGES:
The Client had two primary requirements to solve the purpose of analysis-
- Comparison of distributions between many groups
- Single Chart for data Visualization comprised of different Statistical observations like-
mean, median, highest, lowest distance and many more.
The dashboard should complete the following objectives: –
- X-axis should represent the part names.
- Y-axis should represent the distance travelled by the vehicle.
- The chart should represent the required metrics.
PROPOSED SOLUTION:
After multiple rounds of discussions and brain storming sessions we have finalized a proposal contains most appropriate tool, visualization and approach to resolve the issue .
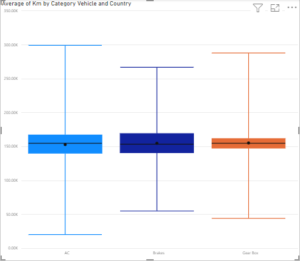
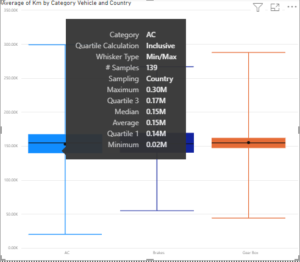
With client concern and approval , The Amlgo Team, created a Box and Whisker chart in which a random sample had considered from the complete data set on the basis of the part category calculated the mean, median, lowest, highest distance along with other metrics. All metrics of a single part will be in a single box.
CONCLUSION:
The final dashboard helped in presentation of 5-point summary and outliers. It was easy to compare multiple data sets side by side in this dashboard and retrieve comparative information for decision making and apart from that it handles extremely large data sets easily.
SCREENSHOTS: –
This is how the visual is going to look like. Obviously, it is not the original data but a random data taken from the internet.