In today’s data-driven world, businesses are constantly seeking innovative ways to harness the power of their data for strategic decision-making. Business Intelligence (BI) tools play...
AI is significantly transforming the automotive industry, revolutionizing vehicle design, safety, efficiency, autonomous driving technology, and manufacturing processes. The implementation of AI holds the promise...
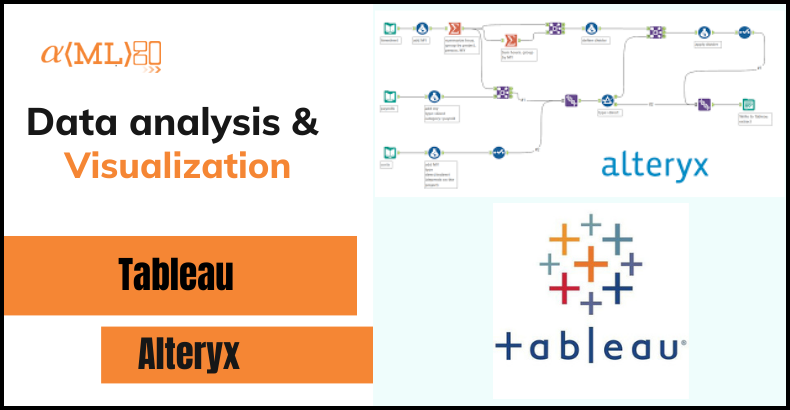
Creating Beautiful Maps with Alteryx and Tableau Maps are a powerful tool for visualizing and understanding spatial data. They allow us to see patterns, trends,...
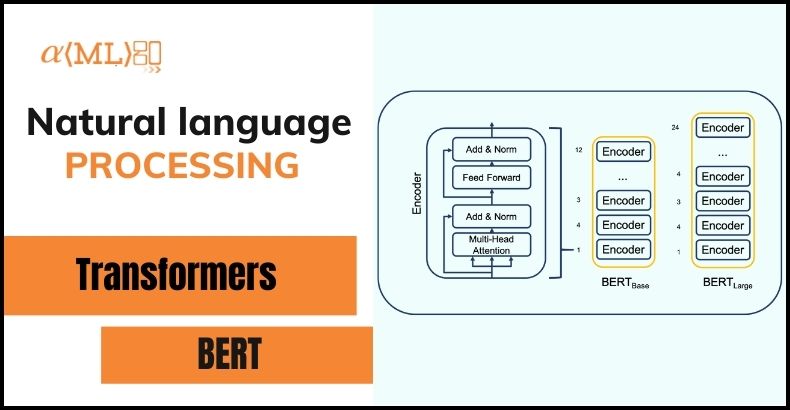
BERT – Transfer Learning Bi-directional Encoder Representations from Transformers, or BERT is a language representation model developed by Google Research in May 2019 which formed...
From organizational charts to bill of materials, Recursive CTEs can help you efficiently analyse hierarchical and recursive data in a variety of contexts. A recursive...
Data is an essential component of any analysis, and it is crucial that it be clean and well-prepared before beginning your analysis. Poorly prepared data...
Automating Alteryx can greatly improve the efficiency and speed of data analysis and data processing workflows. In this blog, we will explore the various ways...
“The effectiveness of data visualization can be gauged by its simplicity, relevancy, and its ability to hold the user’s hand during their data discovery journey.”...
Reports & Dashboards for Sales Enablement Process Objectives The main objectives of this marketing project were to: Visualize sales data to identify trends and patterns....
A database is a collection of data stored systematically with the ability to manipulate. A database is a complete Data management tool provided to perform...